Logistic Regression
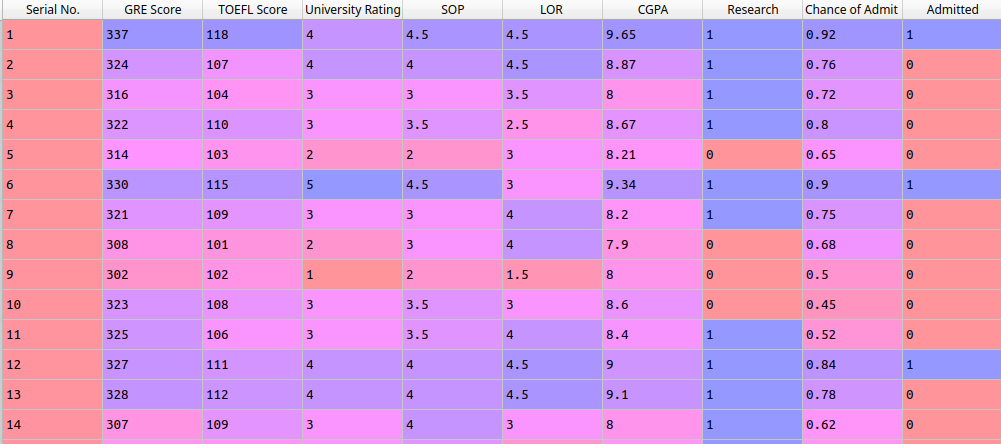
To talk about Logistic Regression, I used the same dataset of the post about Multiple Linear Regression. It has scores of exams that help students to enter colleges.
The Logistic Regression uses binary values to classify and this dataset doesn’t have this type of data. So, I inserted a new column Admitted.

I added a new column with a basis on column Chance of Admit. If the chances are greater than 80% then the value is 1 if not is 0.
base['Admitted'] = [1 if chance > 0.8 else 0 for chance in base['Chance of Admit ']]
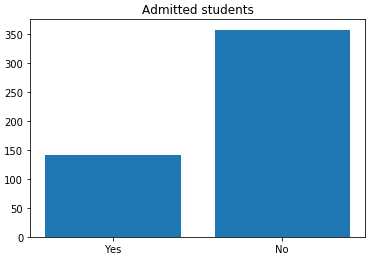
To get a better visualization I plotted the chart below.
labels = ['Yes', 'No']
x_pos = [0, 1]

admitted = len(base[base['Admitted'] == 1])
not_admitted = len(base[base['Admitted'] == 0])

plt.bar(x_pos, [admitted, not_admitted])
plt.xticks(x_pos, labels)
plt.title('Admitted students')

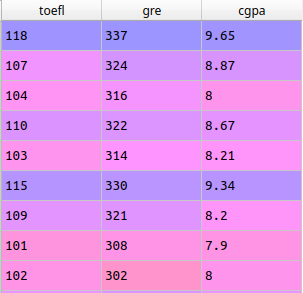
After I started to prepare the data. Firstly, I made a new DataFrame only with the necessary columns.
toefl = base.iloc[:, 2].values
gre   = base.iloc[:, 1].values
cgpa  = base.iloc[:, 6].values


x = pd.DataFrame(np.c_[toefl, gre, cgpa], columns=['toefl','gre', 'cgpa'])

# Admitted Column
y = base.iloc[:, -1].values

I separated dataset on training and test data for I can create a model to predict.
X_train, X_test, y_train, y_test = train_test_split(x,y, test_size=0.20, random_state=42)

logmodel = LogisticRegression()
logmodel.fit(X_train,y_train)

predictions = logmodel.predict(X_test)
Then I generated a Confusion Matrix and scores to evaluate the result.
cnf_matrix = metrics.confusion_matrix(y_test, predictions)
sns.heatmap(cnf_matrix, annot=True)
plt.ylabel('Actual label')
plt.xlabel('Predicted label')

print("Accuracy: ", metrics.accuracy_score(y_test, predictions))
print("Precision: ", metrics.precision_score(y_test, predictions))
print("Recall: ", metrics.recall_score(y_test, predictions))

# Output
# Accuracy: 0.85
# Precision: 0.730769230769
# Recall: 0.703703703704
Considerations
With the Confusion Matrix we can conclude that:
True positive: 19 (the model predicted a positive result and it was positive).
True negative: 66 (the model predicted a negative result and it was negative).
False-positive: 7 (the model predicted a positive result and it was negative).
False-negative: 8 (the model predicted a negative result and it was positive).
and with the scores:
Accuracy: 85% was predicted correctly.
Precision: 73% of the time the model is correct about its predictions.
Recall: 70% of the time the model expected true result.
The contents that I have shared are about what I am learning, so, if you found some error, on the code, concepts, considerations even spelling please let me know, like this, you will help me a lot to avoid more mistakes.
python
linear regression
data science
statistic
Discussion and feedback