Multiple Linear Regression
In this post, I want to show how I’ve implemented Multiple Linear Regression with a dataset about graduation that I found on Kaggle.
Firstly, I imported the libraries, the dataset and I verified NaN values too (there were no).
import pandas as pd
import matplotlib.pyplot as plt
import numpy as np
import seaborn as sns
from sklearn.linear_model import LinearRegression
from sklearn.model_selection import train_test_split
from sklearn.metrics import mean_squared_error, r2_score

base = pd.read_csv('dataset.csv')
base.isna().sum()
base.head()
The dataset owns the following columns.

After this, as the Linear Regression post, also I used Seaborn to generate a heatmap with correlation among variables.
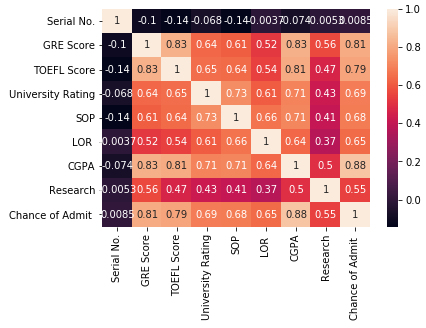
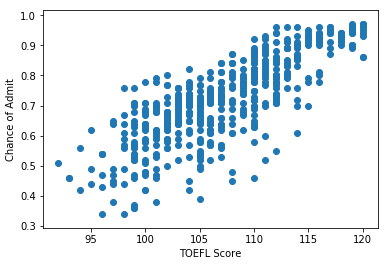
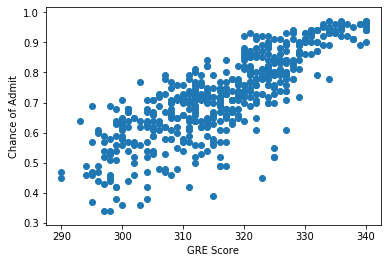
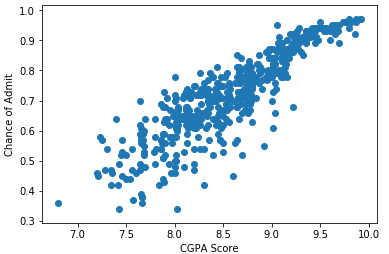
I could see that exits strong correlations among GRE Score, TOEFL Score and CGPA Score with Chance of Admit, then I plotted charts to get better visualization.
I stored the Change of Admit values on a variable called y.
# chance of admit
y = base.iloc[:, -1].values
And then I generate the charts.
#toefl
toefl = base.iloc[:, 2].values
toefl = toefl.reshape(-1, 1)
plt.scatter(toefl, y)
plt.xlabel('TOEFL Score')
plt.ylabel('Chance of Admit')
#gre
gre = base.iloc[:, 1].values
gre = gre.reshape(-1, 1)
plt.scatter(gre, y)
plt.xlabel('GRE Score')
plt.ylabel('Chance of Admit')
#cgpa
cgpa = base.iloc[:, 6].values
cgpa = cgpa.reshape(-1, 1)
plt.scatter(cgpa, y)
plt.xlabel('CGPA Score')
plt.ylabel('Chance of Admit')
With the variables defined, I built the model to test. The first step was to create a new DataFrame.
x = pd.DataFrame(np.c_[toefl, gre, cgpa], columns=['toefl','gre', 'cgpa'])
x.head()
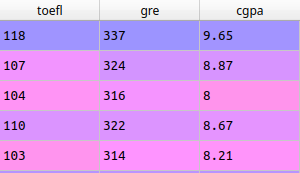
Next, I separated this one in two sets of data.
#split 20% to test and 80% to train
X_train, X_test, Y_train, Y_test = train_test_split(x, y, test_size = 0.2, random_state=42)
For carried out the train and the test I made the code bellow using R2 Score to adjust the model.
# model evaluation for set of training
y_train_predict = lin_model.predict(X_train)
r2 = r2_score(Y_train, y_train_predict)
The result of the training set was:
print("The model performance for the set of training")
print("--------------------------------------")
print('R2 score is %s' %r2)

# Out
# The model performance for the set of training
# --------------------------------------
# R2 score is 0.806069903902
The same process I repeated with the set of testing where I got:
# model evaluation for the set of testing
y_test_predict = lin_model.predict(X_test)
r2 = r2_score(Y_test, y_test_predict)

print("The model performance for the set of testing")
print("--------------------------------------")
print('R2 score is %s' %r2)

# Out
# The model performance for the set of testing
# --------------------------------------
# R2 score is 0.793836133004
Considerations
The results from R2 Score showed that is a good model because set of train and test both were close from 1 that is considered great.
Another point is that to get a high Chance of Admit, the student needs to have mainly the scores cited with great values.
python
linear regression
data science
statistic
Discussion and feedback