Mean Wage from Alagoas
This exercise is from Udemy Course that I did. On the course, I needed to make a table with statistical values (mean, median, standard deviation, etc..). Then I decided to make the same exercise with Python and its libraries.
The teacher of the course has provided a spreadsheet with data got for IBGE in 2010. It was included or this exercise was included a sample with thirty cities and also defined that would be used stratified sample because of mesoregions (Agreste, Leste e Sertão).
My first step was to create a new spreadsheet using the values from the original spreadsheet for became my work easier after I exported to CSV then I imported the using Pandas.
# Import CSV, set semicolon as a delimiter and I inform that NaN is referring to null values
data = pd.read_csv("CidadesAlagoas.csv", delimiter=';', keep_default_na=False, na_values=['NaN'])

# Defined samples number (cities)
NUM_SAMPLE = 30

# The filters of cities by mesoregion
filter_agreste = data[data['mesoregion'] == 'Agreste Alagoano']
filter_sertao  = data[data['mesoregion'] == 'Sertão Alagoano']
filter_leste   = data[data['mesoregion'] == 'Leste Alagoano']
Each mesoregion has a number of cities that need to be drawn and separated proportionally. To pick the cities, first I counted the total of cities by mesoregion.
number_cities_agreste = len(filter_agreste)
number_cities_sertao  = len(filter_sertao)
number_cities_leste   = len(filter_leste)
number_cities = len(data)

print ('''
Number of cities from Agreste Alagoano: %d
Number of cities from Sertão Alagoano: %d
Number of cities from Leste Alagoano: %d
''' %(number_cities_agreste, number_cities_sertao, number_cities_leste))

#-------------------OUT-------------------#
# Number of cities from Agreste Alagoano: 24
# Number of cities from Sertão Alagoano: 26
# Number of cities from Leste Alagoano: 52
#-------------------OUT-------------------#
After this, I calculated the weight to each mesoregion dividing the total of cities from each mesoregion by total of cities from the state.
weight_agreste = float(number_cities_agreste)/number_cities
weight_sertao  = float(number_cities_sertao)/number_cities
weight_leste   = float(number_cities_leste)/number_cities

print ('''
Weight from Agreste Alagoano: %.2f
Weight from Sertão Alagoano: %.2f
Weight from Leste Alagoano: %.2f
''' %(weight_agreste, weight_sertao, weight_leste))

#-----------------OUT---------------#
# Weight from Agreste Alagoano: 0.24
# Weight from Sertão Alagoano: 0.25
# Weight from Leste Alagoano: 0.51
#-----------------OUT---------------#
And then I got the sure quantity cities by mesoregion making a multiplication with weight and total samples.
number_draw_cities_agreste = int(round(weight_agreste * NUM_SAMPLE))
number_draw_cities_sertao  = int(round(weight_sertao * NUM_SAMPLE))
number_draw_cities_leste   = int(round(weight_leste * NUM_SAMPLE))

print ('''
Number from cities for draw in Agreste Alagoano: %.d
Number from cities for draw in Sertão Alagoano: %.d
Number from cities for draw in Leste Alagoano: %.d
''' %(number_draw_cities_agreste, number_draw_cities_sertao, number_draw_cities_leste))

#-------------------------OUT------------------------------#
# Number from cities to draw in Agreste Alagoano: 7
# Number from cities to draw in Sertão Alagoano: 8
# Number from cities to draw in Leste Alagoano: 15
#-------------------------OUT------------------------------#
With the number of cities, I drew them like this.
# The first parameter is the quantity and I set 'replace' as False for do not repeat
draw_agreste = filter_agreste.sample(n=number_draw_cities_agreste, replace=False)
draw_sertao  = filter_sertao.sample(n=number_draw_cities_sertao, replace=False)
draw_leste   = filter_leste.sample(n=number_draw_cities_leste, replace=False)

# I created one DataFrame for each mesoregion
agreste = pd.DataFrame(draw_agreste)
sertao = pd.DataFrame(draw_sertao)
leste  = pd.DataFrame(draw_leste)

# I joined all mesoregions
new_data = pd.concat([agreste, sertao, leste])

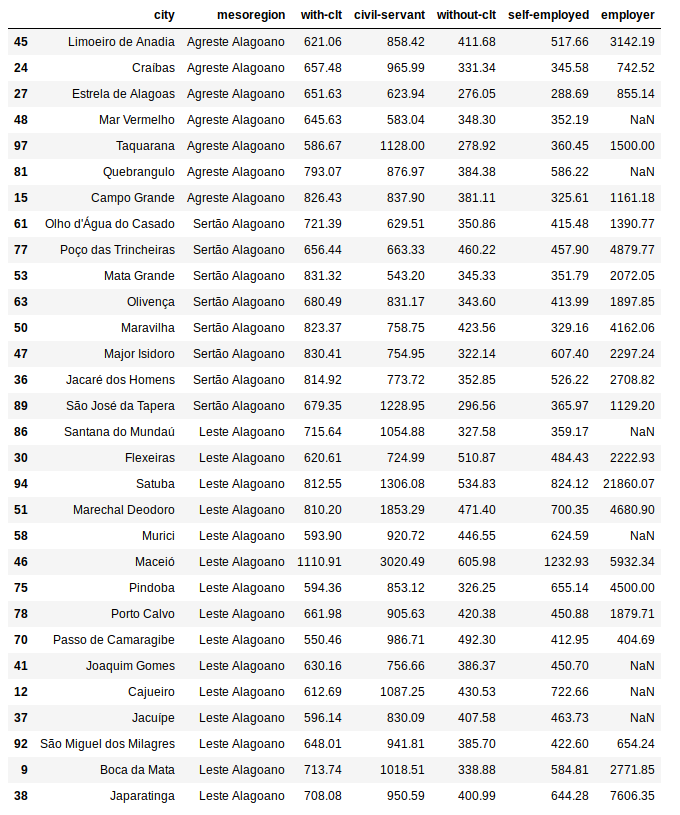
# Then here I show de DataFrame
new_data

With the cities drawn, I needed to get the values asked (mean, median, standard derivation, the coefficient of variation, lowest value, highest value, quantile 25%, quantile 75%, percentile 10% and percentile 90%).
# Describe function shows some values for the default
describe = new_data.describe()

# I created a dictionary to organize the values by position
result = {
    'with-clt': {
        'mean': describe['with-clt']['mean'],
        'median': new_data['with-clt'].median(),
        'cv': (describe['with-clt']['std']/describe['with-clt']['mean'])*100,
        'sd': describe['with-clt']['std'],
        'min': describe['with-clt']['min'],
        'max': describe['with-clt']['max'],
        'q1': describe['with-clt']['25%'],
        'q3': describe['with-clt']['75%'],
        'p10': new_data['with-clt'].quantile(.10),
        'p90': new_data['with-clt'].quantile(.90)

    },
    'civil-servant': {
        'mean': describe['civil-servant']['mean'],
        'median': new_data['civil-servant'].median(),
        'cv': (describe['civil-servant']['std']/describe['civil-servant']['mean'])*100,
        'sd': describe['civil-servant']['std'],
        'min': describe['civil-servant']['min'],
        'max': describe['civil-servant']['max'],
        'q1': describe['civil-servant']['25%'],
        'q3': describe['civil-servant']['75%'],
        'p10': new_data['civil-servant'].quantile(.10),
        'p90': new_data['civil-servant'].quantile(.90)
    },
    'without-clt': {
        'mean': describe['without-clt']['mean'],
        'median': new_data['without-clt'].median(),
        'cv': (describe['without-clt']['std']/describe['without-clt']['mean'])*100,
        'sd': describe['without-clt']['std'],
        'min': describe['without-clt']['min'],
        'max': describe['without-clt']['max'],
        'q1': describe['without-clt']['25%'],
        'q3': describe['without-clt']['75%'],
        'p10': new_data['without-clt'].quantile(.10),
        'p90': new_data['without-clt'].quantile(.90)
    },
    'self-employed': {
        'mean': describe['self-employed']['mean'],
        'median': new_data['self-employed'].median(),
        'cv': (describe['self-employed']['std']/describe['self-employed']['mean'])*100,
        'sd': describe['self-employed']['std'],
        'min': describe['self-employed']['min'],
        'max': describe['self-employed']['max'],
        'q1': describe['self-employed']['25%'],
        'q3': describe['self-employed']['75%'],
        'p10': new_data['self-employed'].quantile(.10),
        'p90': new_data['self-employed'].quantile(.90)
    },
    'employer': {
        'mean': describe['employer']['mean'],
        'median': new_data['employer'].median(),
        'cv': (describe['employer']['std']/describe['employer']['mean'])*100,
        'sd': describe['employer']['std'],
        'min': describe['employer']['min'],
        'max': describe['employer']['max'],
        'q1': describe['employer']['25%'],
        'q3': describe['employer']['75%'],
        'p10': new_data['employer'].quantile(.10),
        'p90': new_data['employer'].quantile(.90)
    }
}
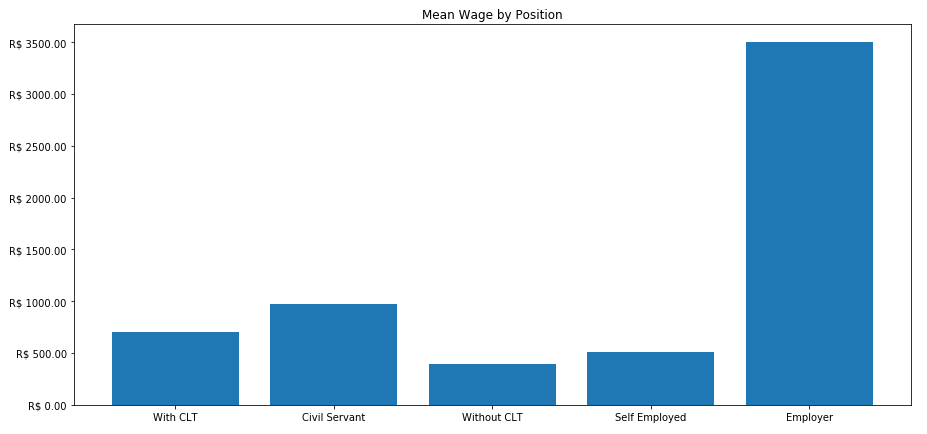
To finish the exercise I made a chart with the mean wage by position.

Considerations
This was another exercise that I made to improve my skills. So, if you have any doubt or suggestion your comment are welcome :)
data science
python
statistic
Discussion and feedback