My first project with Data Science
In this post, I pretend to describe my first project with Data Science. The project consists to study Trimania data that are available on its site. On this project, I got simple information like drawn numbers e neighborhoods with most winners.
How I got data
To get data I built a crawler. It was developed with PHP and a Symfony’s library. The informations received are storage on two tables on database. One is for locations and other for numbers.

The main difficulty to carry out this project is clean data. Always that imported a set of data was needed to realize data cleaning because constantly the city name came wrong. As an example in draws where there are winners in Joinville. On site, the data are shown like this: “Bairro / Joinvillle”, “Joinvile/Bairro”, “Joinville /Bairro”. Below some example about the problem on 2nd September 2018.
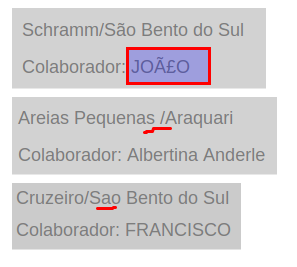
If I didn’t the data correction, the analysis would be got wrong. The next image is shown some neighborhoods with the city after data cleaning.
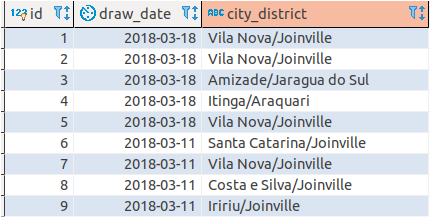
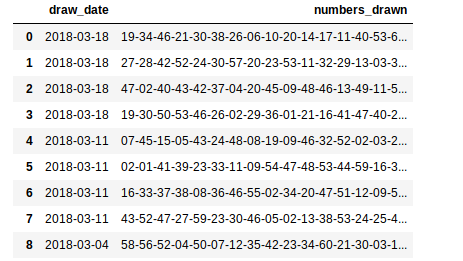
The drawn numbers don’t have an exact quantity like Mega-Sena, in other words, the quantity of drawn number will variate. Then I’ve decided to create one column for all numbers and separate them by a hyphen.

Analysis of the numbers
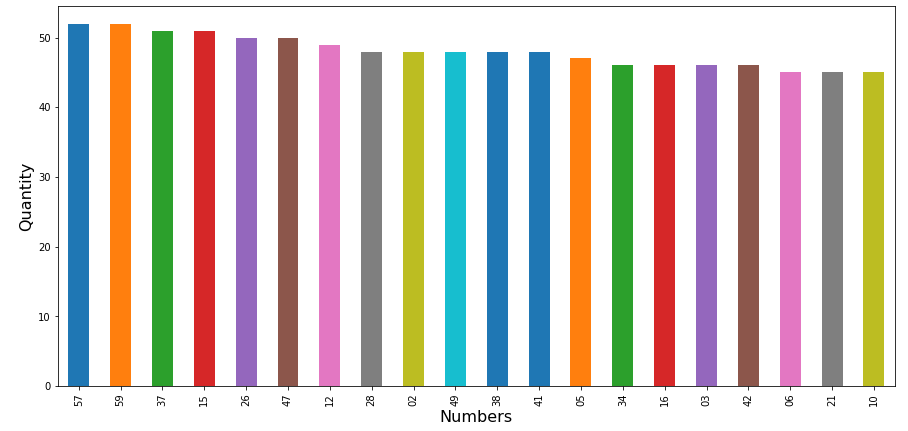
In this project I created a question that I would like to answer, so the question I elaborated was ‘What are the most numbers drawn between January and April of 2018?’. To get this I exported a CSV file and after I used the Jupyter Notebook to analyze.
# On this line, I read and show a preview of what was imported
csv = pd.read_csv('trimaniaNumbers.csv', delimiter=';');
csv
# Dictionary to insert the numbers
numbers = {
    'number':[]
}

# Separating the numbers by a hyphen and adding on a dictionary
for lines in csv['numbers_drawn']:
    for number in lines.split('-'):
            numbers['number'].append(number)


# I used the dictionary to generate a new DataFrame
df = pd.DataFrame(numbers)

# I count the quantity repeated numbers quantity and I get the twenty-first
data = df['number'].value_counts().head(20)
To view a way nicier, I generate a chart of Numbers X Quantity.
# Configuration the font
font = {
    'weight': 'normal',
    'size': 16
}

# Configuration the labels from axes X and Y
plt.xlabel('Numbers', fontdict=font)
plt.ylabel('Quantity', fontdict=font)

# It is displayed a bar chart
data.plot(kind='bar')
plt.show()
Analysis of the locations
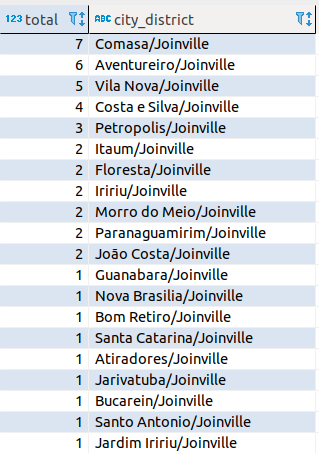
On the study of the locations also I created another question ‘What the neighborhoods had the most winners between January and April of 2018 in Joinville?’. To answer such question I made only a simple SQL.
SELECT COUNT(*) AS total, city_district
FROM locations
WHERE draw_date BETWEEN '2018-01-01' AND '2018-04-30'
      AND city_district like '%/Joinville%'
GROUP BY city_district
ORDER BY total DESC
After to execute I got my answer.
Considerations
This project there no many complexities. I still need to improve my skills building challenges more complex. Even so, I believe this exercise has great value. If you have some doubt or suggestion, feel free to comment :)
data science
python
Discussion and feedback